People that never tried programming often think, that programming is something very complicated and hard to start. Honestly I had the same thinking until I tried python – one of the most intuitive programming languages with a low entry barrier. While learning programming it’s important to be able instantly try your knowledge in practice. In case of python it’s really easy – just start using python’s library “pandas” instead of excel in your everyday tasks.

In order to run python code – you need an environment (program) where you will be able to execute your code. For beginners i would definitely recommend Jupyter Notebook – an open-source application where you can execute your code, create visualisations and notes. The easies way to install Jupyter Notebook on your computer – download it as a part of Anaconda distribution. You can download it here:
https://www.anaconda.com/distribution/
Download Anaconda for your OS with 3 python’s version, and launch it – you should see panel like this:
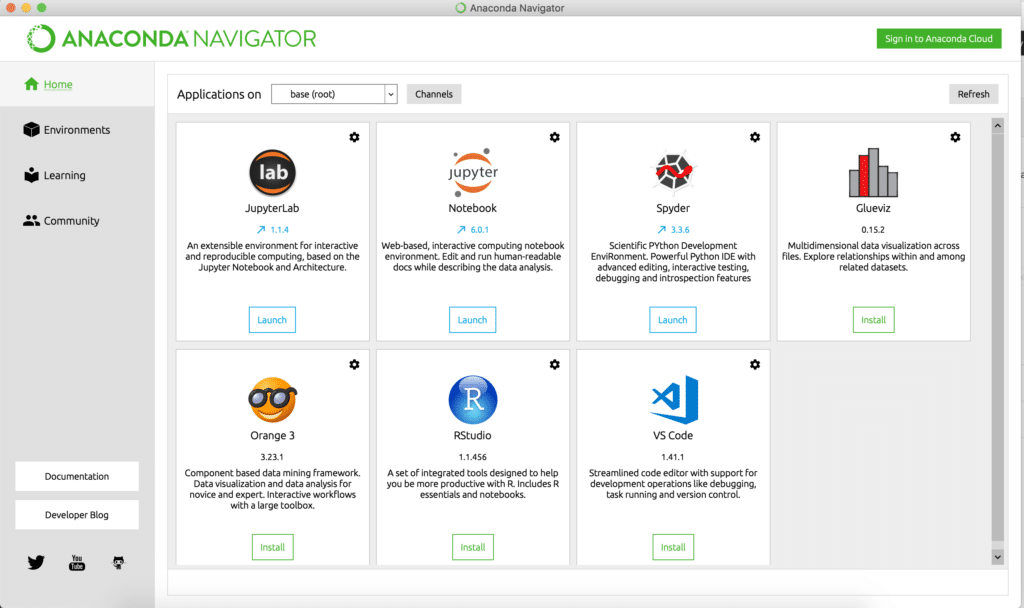
Run Jupyter Notebook
Click “Launch” button under “Jupyter Notebook” logo – and Anaconda should open Jupyter Notebook in your browser:
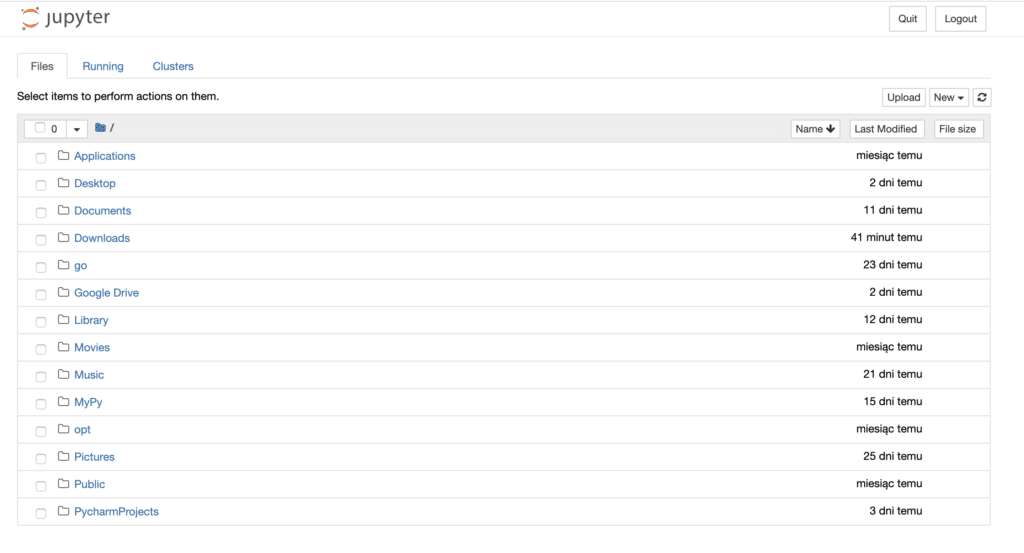
Here I would suggest you to create a specific folder for your pyton scripts:
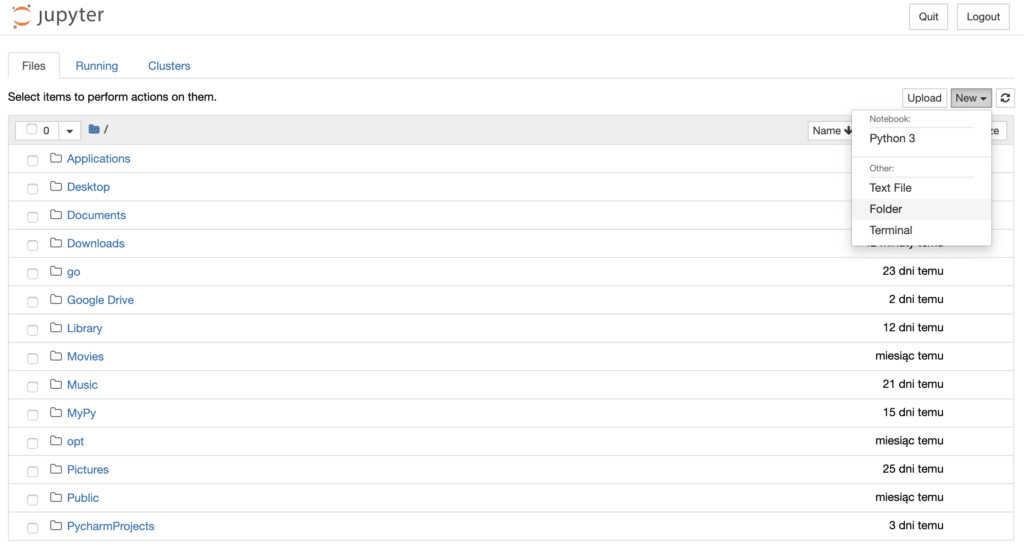
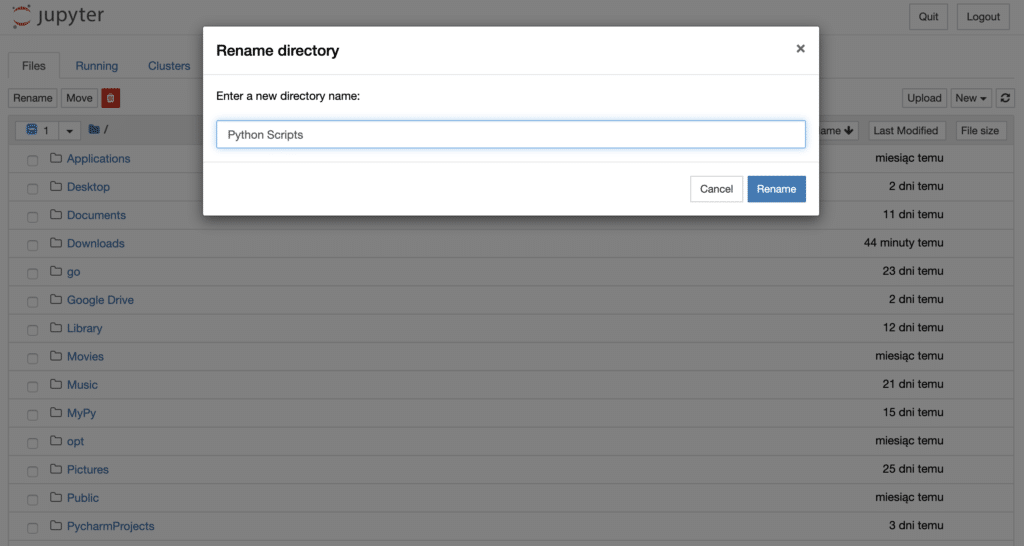
Create a new folder and then rename it – I called it “Python Scripts”:
Now navigate to that folder and create a new Python 3 file there:

If you see something like this – congratulations, it was the hardest part:

You can also rename your “Untitled” notebook to something like “My first script”, and start coding. =)
Pandas Data Frame
In order to use pandas library we need to import it at first – just add
“import pandas as pd” at the beginning of your script.
In pandas the main object we usually interact with – called “data frame”, think of it like an excel table. Let’s try to create our own simple data frame:
import pandas as pd
df = pd.DataFrame({'col1': ["a",  "b", "c", "c"], 'col2': [1, 2, 3, 3]})
display(df)
Paste this code to Jupyter cell and click “Run” button:

An output should be similar to this:

As you can see in code – we’ve created a variable called “df” that contains our table. The table consist of two columns – “col1” and “col2”. At the left side of it you can see indexes started from 0 – think of them like row numbers.
Now let’s try to perform simple operations with our table. Let’s find out the sum of column “col2”:
import pandas as pd
df = pd.DataFrame({'col1': ["a",  "b", "c", "c"], 'col2': [1, 2, 3, 3]})
print(sum(df['col2']))
As you can see – our table have two similar last rows. We also can make a deduplication in order to delete duplicated rows before calculating the sum of column “col2”:
import pandas as pd
df = pd.DataFrame({'col1': ["a",  "b", "c", "c"], 'col2': [1, 2, 3, 3]})
df = df.drop_duplicates()
print(sum(df['col2']))
Also we can group values in “col1” and find the sum of values in “col2” for each group:
import pandas as pd
df = pd.DataFrame({'col1': ["a",  "b", "c", "c"], 'col2': [1, 2, 3, 3]})
print(df.groupby(['col1']).sum())
Try with your own Excel / CSV files
If you want to open your own files in pandas – place them in the same folder as your Jupyter Notebook:

As you can see – I have two files: “names.csv” and “names.xlsx”. Let’s try to open csv first:
import pandas as pd
df = pd.read_csv('names.csv')
display(df)
Remember that some csv (comma separated values) files actually are not actually separated with commas. My csv file “names.csv” was separated with ;

If you have the same problem – just add “sep” parameter to read_csv:
import pandas as pd
df = pd.read_csv('names.csv', sep=';')
display(df)
Now your file should be opened properly and transformed to pandas data frame:

With this code I’ve opened my “names.xlsx” file:
import pandas as pd
df = pd.read_excel('names.xlsx')
display(df)
Now let’s open “name.csv”, remove rows where column “Name” contains “Jane” value, and save the result as a new csv.
import pandas as pd
df = pd.read_csv('names.csv', sep=';')
display(df)
df = df[df["Name"] != "Jane"]
display(df)
df.to_csv('names_2.csv')
As we can see the new csv “names_2.csv” was created and saved to the folder where we run our code:

Try to do similar manipulations with your data. The possibilities of pandas library are huge, I just wanted to show you were to start and some basic syntax.
Why I should use Pandas instead of Excel?
- Pandas library is much more faster than Excel, especially on big amounts of data.
- Pandas library is much more flexible than Excel, provided you’ll learn some syntax.
- There are various data visualisation libraries like Seaborn or Plotly which will allow you to visualise your pandas data frames in an efficient manner.
- It is a great opportunity to start learning python and instantly use it in your everyday work.
