“Markov Chain Attribution” is one of the most popular data driven attribution models. The most important concept behind this model is removal effect. In this article I`ll try to explain the math behind removal effect in a simple way without any formulas. As an example we will take a very simple use case – four paths, where Google Ads alone generated 2 conversions, mailing – 1 conversion, Google Ads with mailing – 1 conversion, and also once user that came from Google Ads didn’t converted at all (0 conversions).
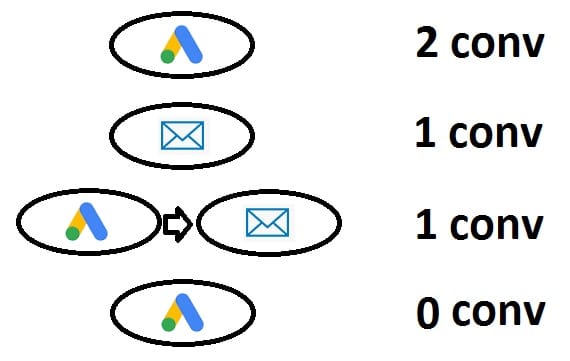
For easier visualization I`ll represent paths it in a table form:
| path | conv |
| google ads | 2 |
| mailing | 1 |
| google ads > mailing | 1 |
| google ads | 0 |
In case of Markov Chains – we should have the initial state and the final state. The initial state could be “start” (this is where our user starts his journey), and the final state will be “conv” or “null” (depending on if our user finished his path with conversion or not). Also we should remember, that now our paths are grouped, so we have the sum of conversions in second column. For easier understanding – let`s transform our data:
| path |
| start > google ads > conv |
| start > google ads > conv |
| start > mailing > conv |
| start > google ads > mailing > conv |
| start > google ads > null |
Based on that data we can count how often our users came from one state to another, and calculate the probabilities of that transitions. First of all we should understand what is the sum of transitions for each channel:

Then we can calculate the probability of transition for each state:
| states | cnt | prob |
| google ads > conv | 2 | 2/4 |
| google ads > mailing | 1 | 1/4 |
| google ads > null | 1 | 1/4 |
| mailing > conv | 2 | 2/2 |
| start > google ads | 4 | 4/5 |
| start > mailing | 1 | 1/5 |
| states | cnt | prob |
| google ads > conv | 2 | 0.5 |
| google ads > mailing | 1 | 0.25 |
| google ads > null | 1 | 0.25 |
| mailing > conv | 2 | 1 |
| start > google ads | 4 | 0.8 |
| start > mailing | 1 | 0.2 |
Now based on that data we know, that when user comes on our site from Google Ads, there is a 0.5 chance that he will convert, 0.25 chance that his next channel will be mailing, and 0.25 chance that he will not convert at all. Of course we need much more data for statistical significance, but that`s how it looks in our simple example. For each state the probabilities always should give 1 in sum. In case of Google Ads we have 0.5+0.25+0.25, in case of mailing its 1, and in case of start its 0.8+0.2, so everything looks properly.
Based on that data we can build the graphs:

The left one represents the sum of transitions, and the right one – the probabilities of that transitions.
Now it`s time to calculate the conversion rate of our model. In order to do that – we should sum the probabilities of all possible ways, when user finishes his journey with a conversion:
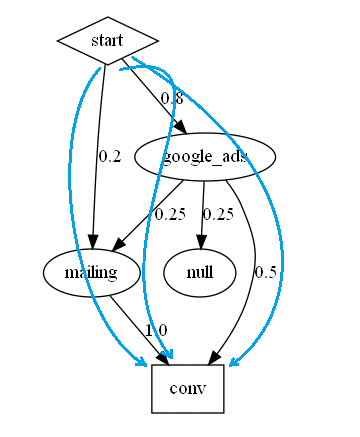
0.2*1.0 + 0.8*0.25*1.0 + 0.8*0.5 = 0.8
So conversion rate of our model is 80%.
Now we can calculate the removal effect for each channel. We should remove each channel from our model – and calculate how it will affect our conversion rate.

Conversion rate of our model without Google Ads:
0.2*1.0 = 0.2
Lest calculate the removal effect:
1 – (0.2 / 0.8) = 0.75
So the removal effect of Google Ads is 75%. That means that
theoretically we could loose 75% of all our conversion if we didn’t have that channel.
Lest do the same calculations for mailing:
Conversion rate: 0.8*0.5 = 0.4
1 – (0.4 / 0.8) = 0.5
Removal effect of mailing is 50%
Now I finally understand it, thank you so much