Welcome! This section is dedicated to Google Analytics App and Frequently Asked Questions related to it.
If you still cannot find the answer to your question here – please feel free to contact me:
serhii.puzyrov@gmail.com.
Google Analytics App – is a free tool that lets you to generate advanced reports based on your Google Analytics data. Application requires you to login into your google account and give permission to view your Google Analytics data. Google Analytics App – is a reporting tool so it’s not able to affect your setups or make any other changes to your Google Analytics account. For more information please follow:
Privacy Policy
Terms of Service
FAQ
- Channels role report
- Channels transition matrix report
- Reduce repeated touchpoints option
- Forecast report
- Seasonality report
Channels role report
Channels role report is aimed to show what role a particular channel plays on user’s path to your conversion. It counts how many times a particular channel performed as a first, in the middle, in the end or as a single channel in path.
Let’s assume that we have such channels paths in Google Analytics:
| Paths | Conversions | |
| Google Ads | 2 | |
| Google Ads > Direct > Direct | 1 |
Let’s transform this paths to simpler table considering conversions sum for each path:
| Paths | |
| Google Ads | |
| Google Ads | |
| Google Ads > Direct > Direct |
Now let’s count how many times each channel appeared on particular position:
Google Ads – 2 times as single in path and 1 time as first in path,
Direct – 1 time in the middle of path, and 1 time in the end of path.
So as a result in Google Analytics App we will get a chart similar to this:
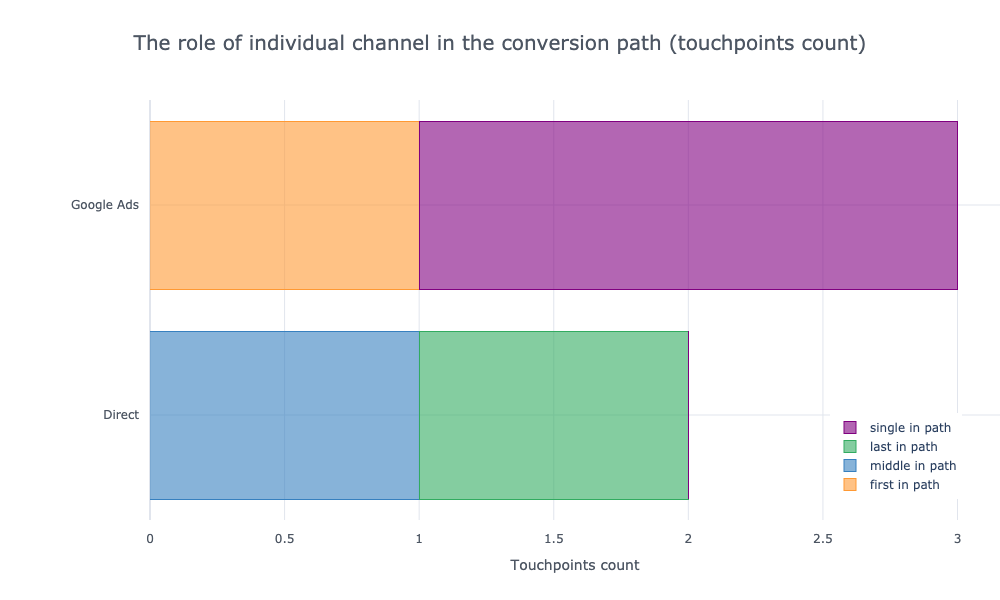
The same chart but with percentage (%) will look like this:

So for Google Ads – 33.3% of it’s all touchpoints appeared in the beginning of the path and other 66.7% – were single in path. In case of Direct – 50% of all it’s touchpoints appeared in the middle of path and 50% in the end of path.
What valuable insights i can get from that report?
That charts should help you in better understanding of your channels, realize thanks to which channels your converted users got on your website or what channels they use when coming back. Some channels may perform more frequently gaining new users, other – play a role of last point in users experience on the way to conversion. That data can be very useful while managing advertising budgets or during building your marketing strategy.
Channels transition matrix report
Channels transition matrix plot shows us frequency of transitions between particular channels, which user do on the way to conversion.
Let’s assume that we have such channels paths in Google Analytics:
| Paths | Conversions | |
| Google Ads | 2 | |
| Google Ads > Direct > Direct | 1 |
Here we should think about each channel as some “state”, which user comes through during his journey on his way to conversion. In this case we should add two additional states: “start” and “conversion” so each path will start from state called “start”, and finish in the state called “conversion”. Let’s transform our paths to simpler table considering conversions sum and two new states:
| Paths | |
| start > Google Ads > conversion | |
| start > Google Ads > conversion | |
| start > Google Ads > Direct > Direct > conversion |
Using that data we can count sum of transitions between each combination of states presented in our paths:
| FROM | TO | Transitions count | |
| start | Google Ads | 3 | |
| Google Ads | conversion | 2 | |
| Google Ads | Direct | 1 | |
| Direct | conversion | 1 | |
| Direct | Direct | 1 |
Now let’s count % frequency of transitions for each state.
In case of “start” we have only one combination – so we will get 100% for transition from start to Google Ads:
| FROM | TO | Transitions count | Transitions frequency | |
| start | Google Ads | 3 | 100% |
In case of “Google Ads” we have two variants of transition: from Google Ads to conversion and from Google Ads to Direct. The sum of all transitions equals to 2 + 1 = 3, so for transition “from Google Ads to conversion” transitions frequency equals to 2 / 3 = 66.7%, and for “from Google Ads to Direct” transition it equals to 1 / 3 = 33.3%:
| FROM | TO | Transitions count | Transitions frequency | |
| Google Ads | conversion | 2 | 66.7% | |
| Google Ads | Direct | 1 | 33.3% |
For “Direct” state calculations will look like this:
| FROM | TO | Transitions count | Transitions frequency | |
| Direct | conversion | 1 | 50% | |
| Direct | Direct | 1 | 50% |
So for data above in Google Analytics App we will get a chart similar to this:
You can notice that each row in this matrix plot will sum to 100%.
The chart below is for the same data but here we have transitions counts instead of percents:
What valuable insights i can get from that report?
That charts should show you the “flow” of converted users between your channels. Darker cells will show through which states your users come through more frequently on their journey to conversion. Some channels may perform often as a supportive channel, what can be missed during analysis using standard attribution models. That analysis can show you “hidden” valuable players of your marketing mix and help you in better budget managing.
Reduce repeated touchpoints option
This option lets you to reduce repeated one by one touchpoints. Let’s assume we have such paths:
| Paths | |
| Google Ads > Direct | |
| Organic > Organic > Direct > Direct | |
| Google Ads > Direct > Direct > Direct > Direct > Organic |
So after turning on option “Reduce repeated touchpoints” – our paths will be transformed to this:
| Paths | |
| Google Ads > Direct | |
| Organic > Direct | |
| Google Ads > Direct > Organic |
What it gives you?
This option lets you to reduce importance of channels, which are often repeated on conversion paths – such as Direct or Banner Views if you have them on your paths. Trying this option – gives you another point of view on generated reports.
Forecast report
This report predicts the behaviour of selected metric based on historical data. Report uses an open source library created by Facebook called “Prophet”, you can read more about this library on it’s official page:
https://facebook.github.io/prophet/docs/quick_start.html
For time series forecasting Prophet uses three main components: trend, seasonality, and holidays (optional).
You should remember that in real life there are a lot of unpredictable events that can effect the business, so accuracy of this report is limited and based only on available data. But it still can help you to understand the trends and prospects of your business at the moment.
How can I improve forecast accuracy?
Try to select the largest possible range of dates for which you have registered data. You should remember that there should be at least 730 days (2 years) in a sample in order to create report. More data – better model.
How to read graph?
On graph of forecast report you can see your historical data (1), and what model predicts for for the selected number of days (2).
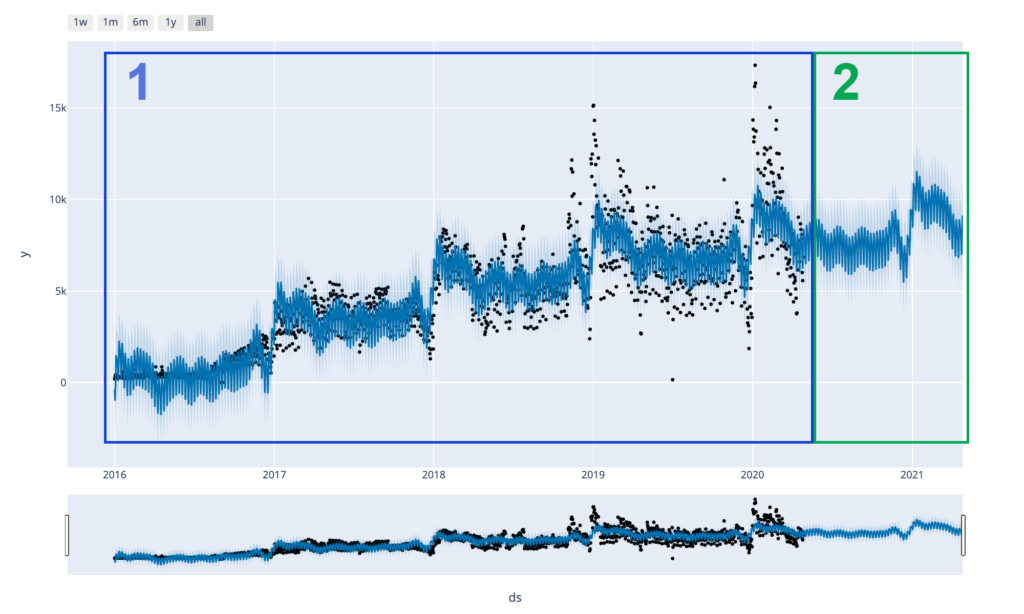
Black dots on graph – is your actual data, and blue line – is how model describes that data. When the black dots ends – model tries to continue the trend and make a forecast.
Seasonality report
This report shows you the seasonality of selected metric based on historical data. Report uses an open source library created by Facebook called “Prophet”, you can read more about this library on it’s official page:
https://facebook.github.io/prophet/docs/quick_start.html
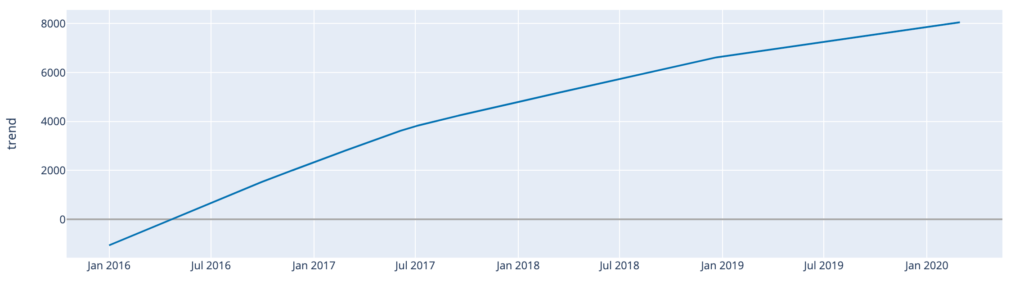
This report contains four graphs: general trend, holidays (optional), yearly and weekly seasonality.
Fro example this graph shows us a growing trend:
Dots on this graph – national holidays of country, which you have selected in report’s configuration:
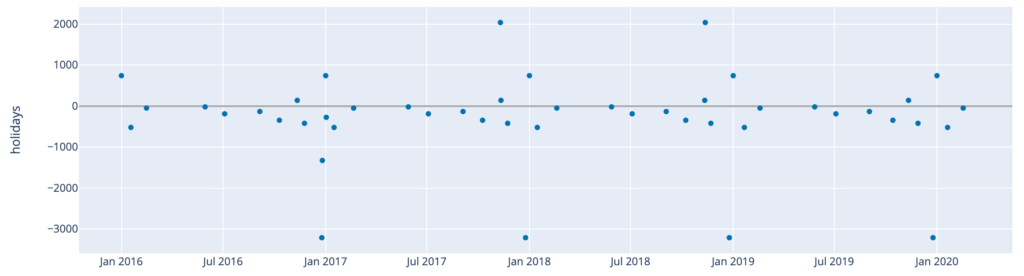
So you can see how appropriate holidays effect selected metric metric.
This graph shows you yearly seasonality so you can see how appropriate months effect your business:
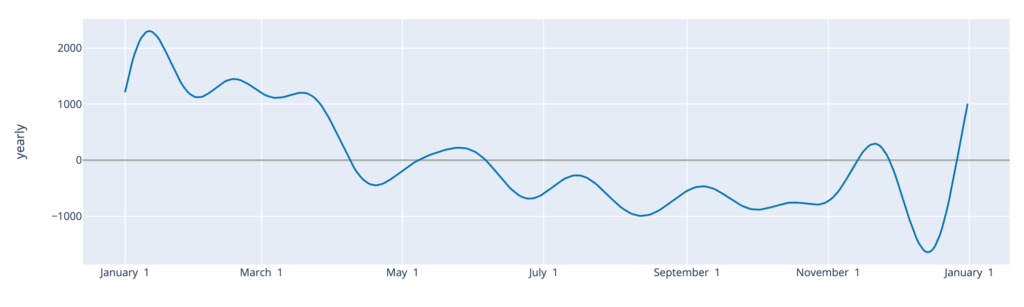
For example on graph above you can see that January – March is the most profitable period.
This graph shows you weekly seasonality so you can see how appropriate weekdays effect your business:
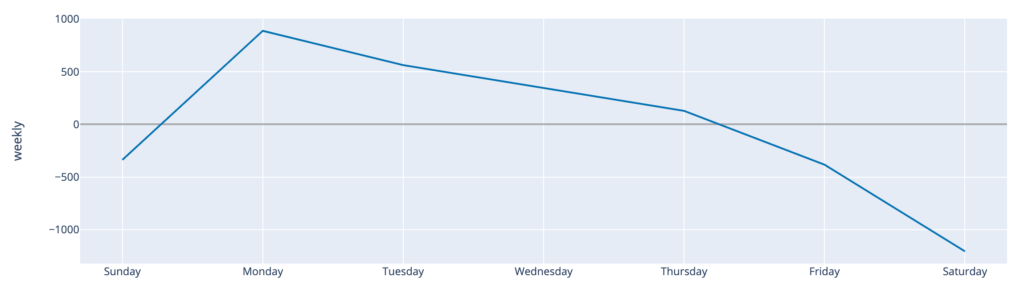
On graph above you can see that Monday is the most profitable day of the week.
How can I improve the accuracy of this report?
Try to select the largest possible range of dates for which you have registered data. You should remember that there should be at least 730 days (2 years) in a sample in order to create report. More data – higher accuracy.